Data Science

From ten spreadsheets to a single dashboard.

Sound familiar?

You have the data. The hard part is seeing it in time.

  • My information is scattered across ten different spreadsheets.

  • Every month I lose days building the same report by hand.

  • I decide by gut feeling because I can't see the numbers in time.

  • Our data lives in WhatsApp, in emails and in people's heads.

What we do

From the spreadsheet to the dashboard that updates itself.

  • Dashboards

    One place to see how your operation is doing, with indicators that update without anyone building them.

  • Automated reports

    Each month's report, ready and always in the same format, with no copying and pasting between files.

  • Analysis and models

    We cross your data to answer specific business questions and anticipate what's coming.

  • Applied AI

    We automate repetitive tasks and classify information with artificial intelligence where it actually helps.

Plans

A plan for every step of the way.

Clear, automated indicators from the first month.

  • Basic

    Ideal for small companies that want to start with clear, automated indicators.

    • 1 interactive Power BI dashboard
    • Monthly report of key KPIs
    • Email support (48-hour response)
    • Automatic data refresh once a week
    I want this plan
  • Professional

    For growing companies that need more analytical depth and constant monitoring.

    • Up to 3 custom dashboards
    • Weekly online executive report
    • Scorecard with automated alerts
    • Business intelligence strategy consulting
    • Daily data refresh
    I want this plan
  • Corporate

    A complete solution for organizations that need advanced BI and full automation.

    • Unlimited dashboards
    • Fully automated reporting
    • Scorecard by area or department
    • Prediction models (regressions)
    • CRM or ERP integration via API
    • Daily data refresh
    • Priority support and weekly meetings
    I want this plan

Need something specific?

If you need something outside these plans (a one-off dashboard, a custom automation, integrating particular sources or a predictive model), we quote it to fit what your company really needs.

Request a quote
  • Plans adapt to the size and needs of the company.
  • Development outside the original scope is quoted separately.
  • Discounts are available for quarterly or annual contracts.

How we work

From scattered data to decisions, in four steps.

  1. Understand

    Which decisions you want to make and what data you have today, wherever it lives.

  2. Organize

    We clean it, join it and leave a single reliable source.

  3. Visualize

    Dashboards and reports designed for the people who will read them, not the ones who built them.

  4. Automate

    So it updates on its own and the report arrives without anyone assembling it.

Projects

Data that is already being used to decide.

Dashboards, automations and artificial intelligence models for companies in Colombia and Chile. Hover or tap each one to see it.
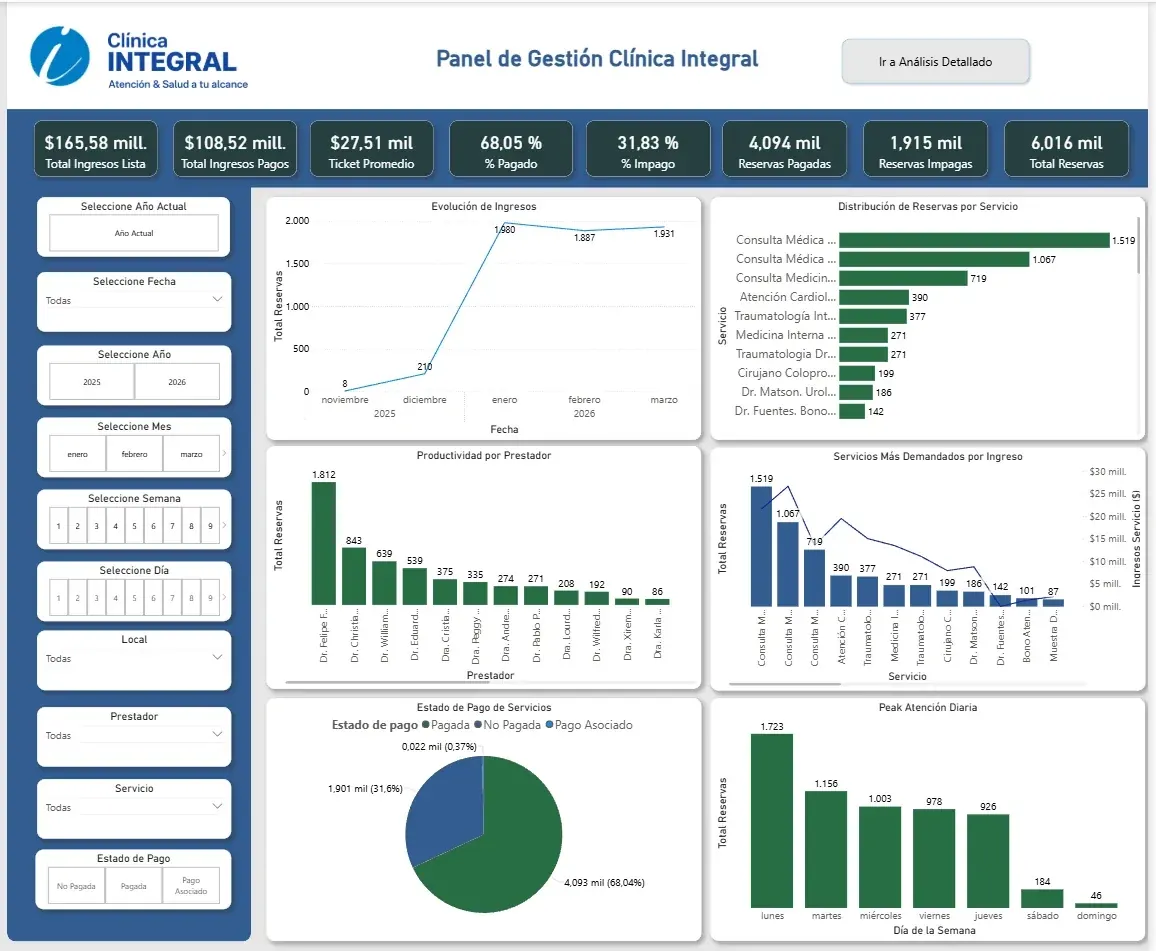
  • Screenshot of the project Clínica Integral: appointment management
    Business Intelligence

    Clínica Integral: appointment management

    How much is billed, how much is still to collect and which days the schedule fills up.
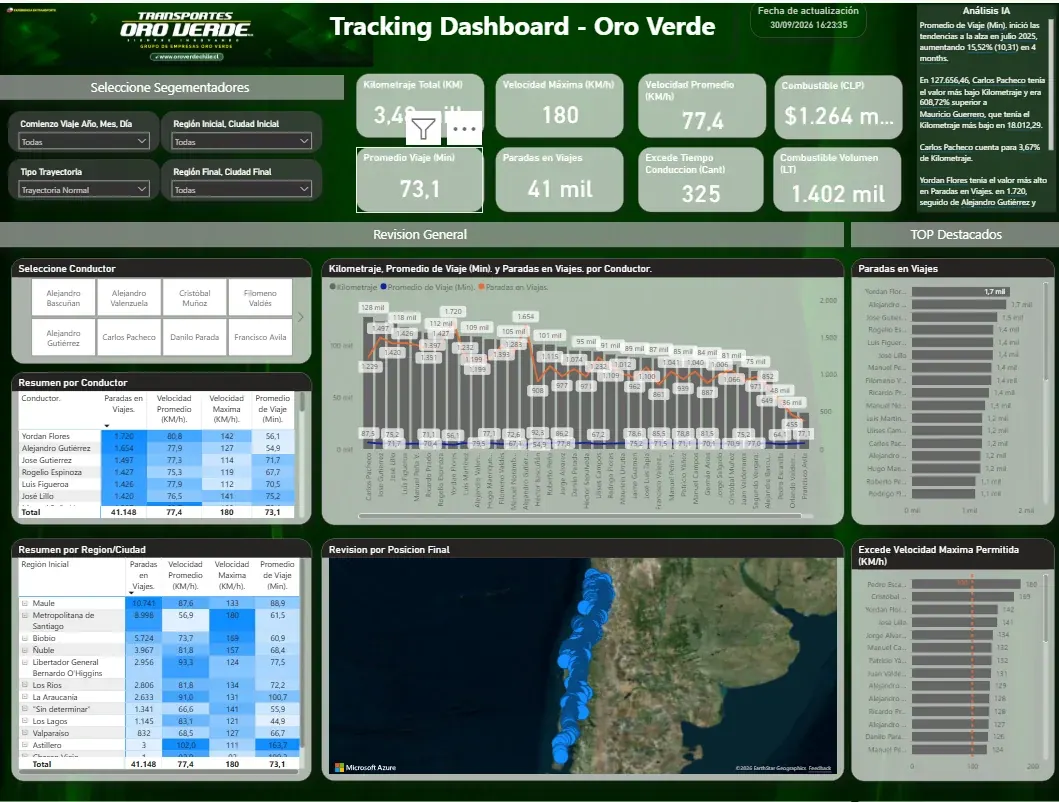
  • Screenshot of the project Oro Verde: fleet tracking
    Business Intelligence

    Oro Verde: fleet tracking

    Drivers, routes, speed and fuel in one dashboard, with a summary written by AI.
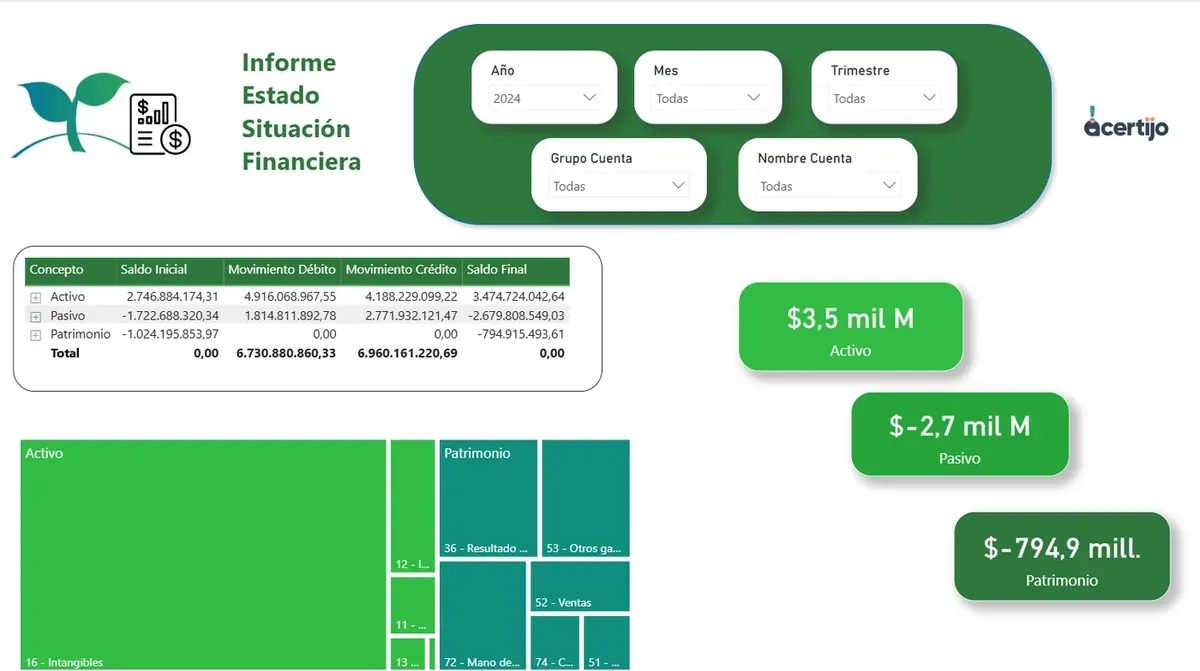
  • Screenshot of the project Acertijo: financial statements
    Business Intelligence

    Acertijo: financial statements

    From the accounting books to the financial report, without building spreadsheets at every close.
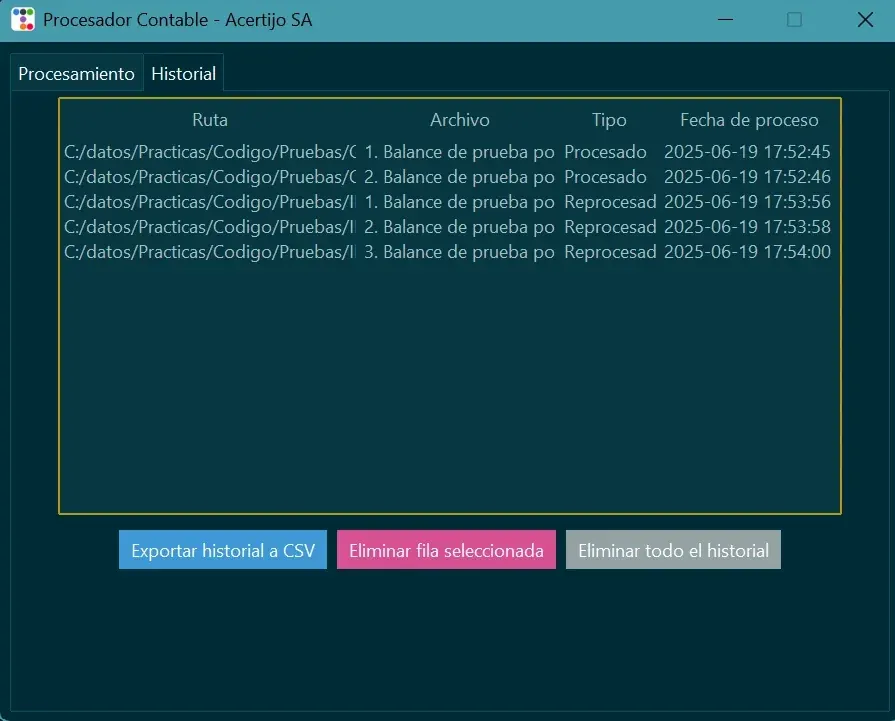
  • Screenshot of the project Automated accounting processor
    Automation

    Automated accounting processor

    Drop the balance sheet in a folder and the report updates itself.
  • Screenshot of the project Shelf audit with computer vision
    Artificial intelligence

    Shelf audit with computer vision

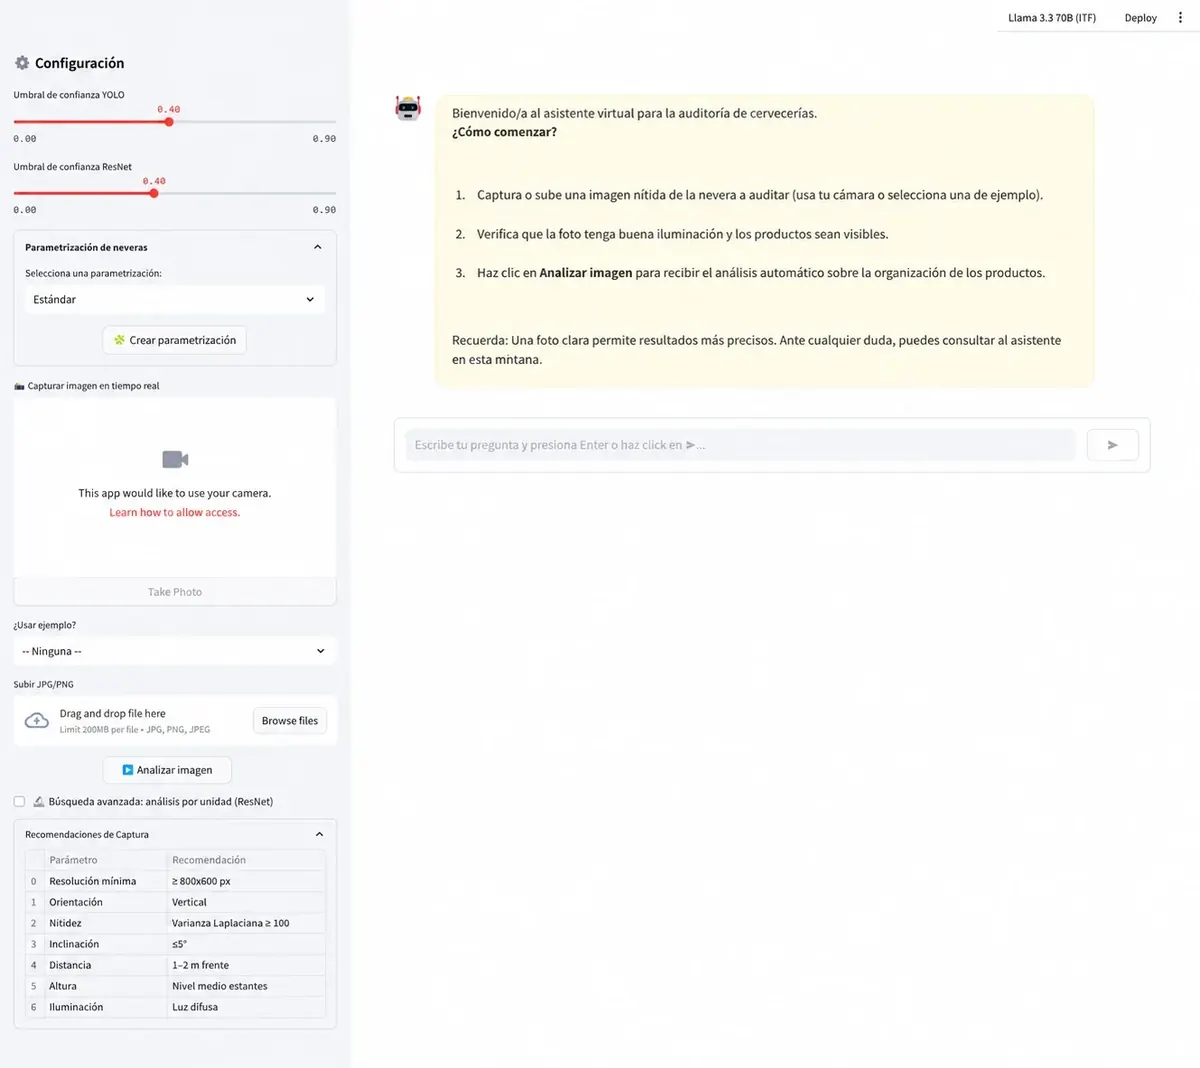
    One photo of the fridge is enough to know whether it matches the planogram.
  • Screenshot of the project Automated sales prospecting
    Automation

    Automated sales prospecting

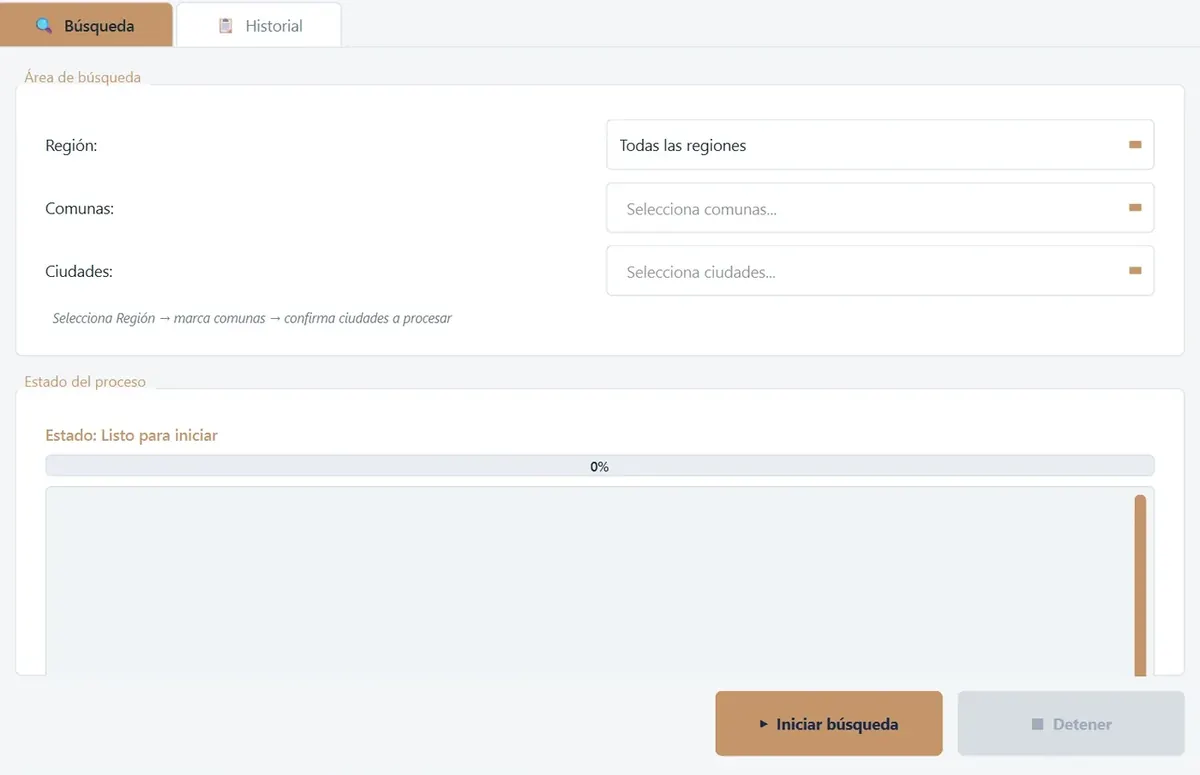
    Lead lists by city, ready to sell, without buying databases.
  • Screenshot of the project Web analytics dashboard
    Business Intelligence

    Web analytics dashboard

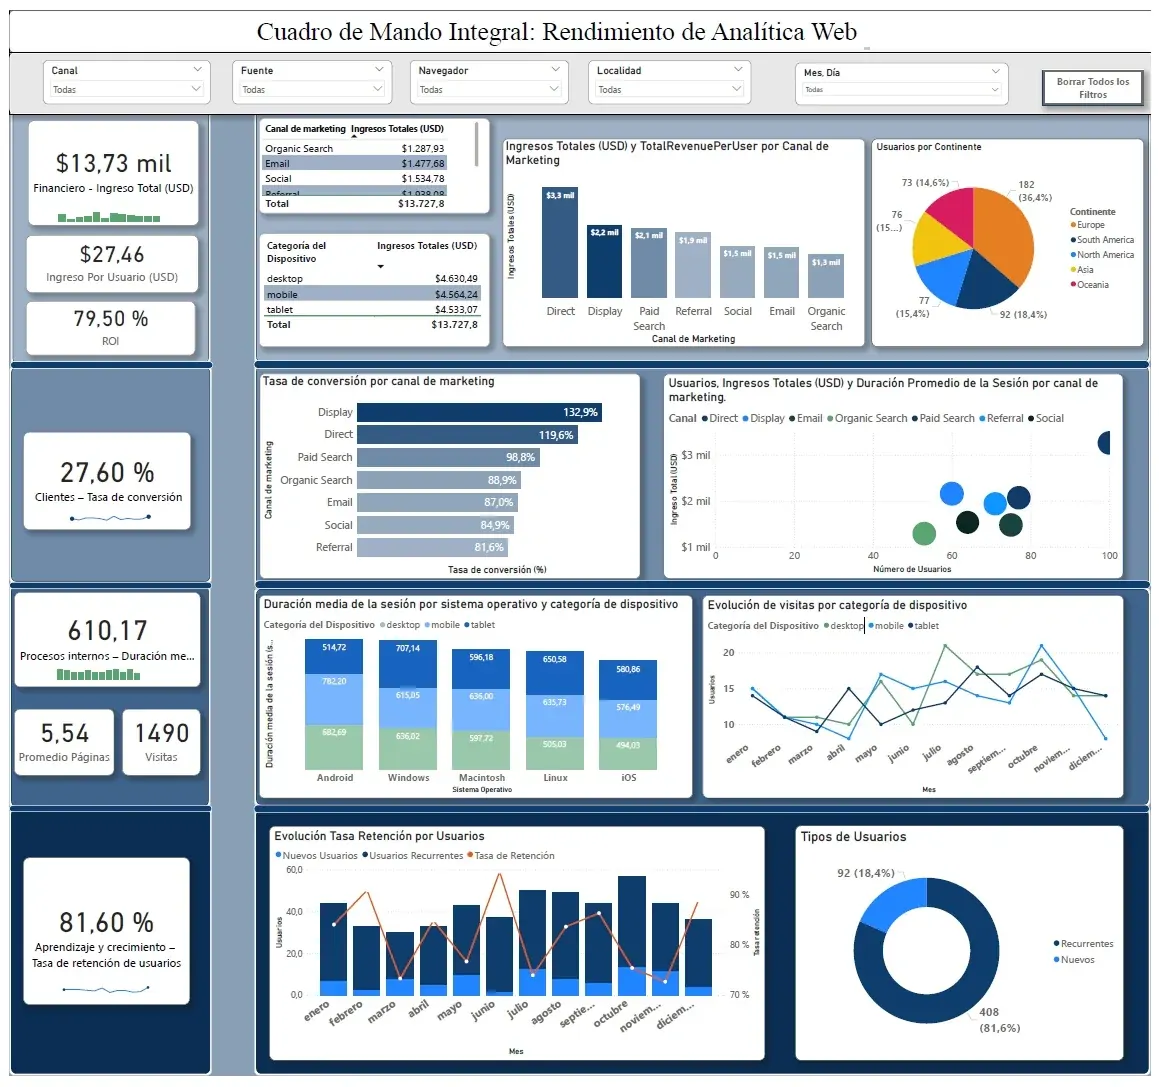
    Which channels bring traffic and which bring revenue, in a single view.
  • Screenshot of the project Real estate market: Seattle and London
    Business Intelligence

    Real estate market: Seattle and London

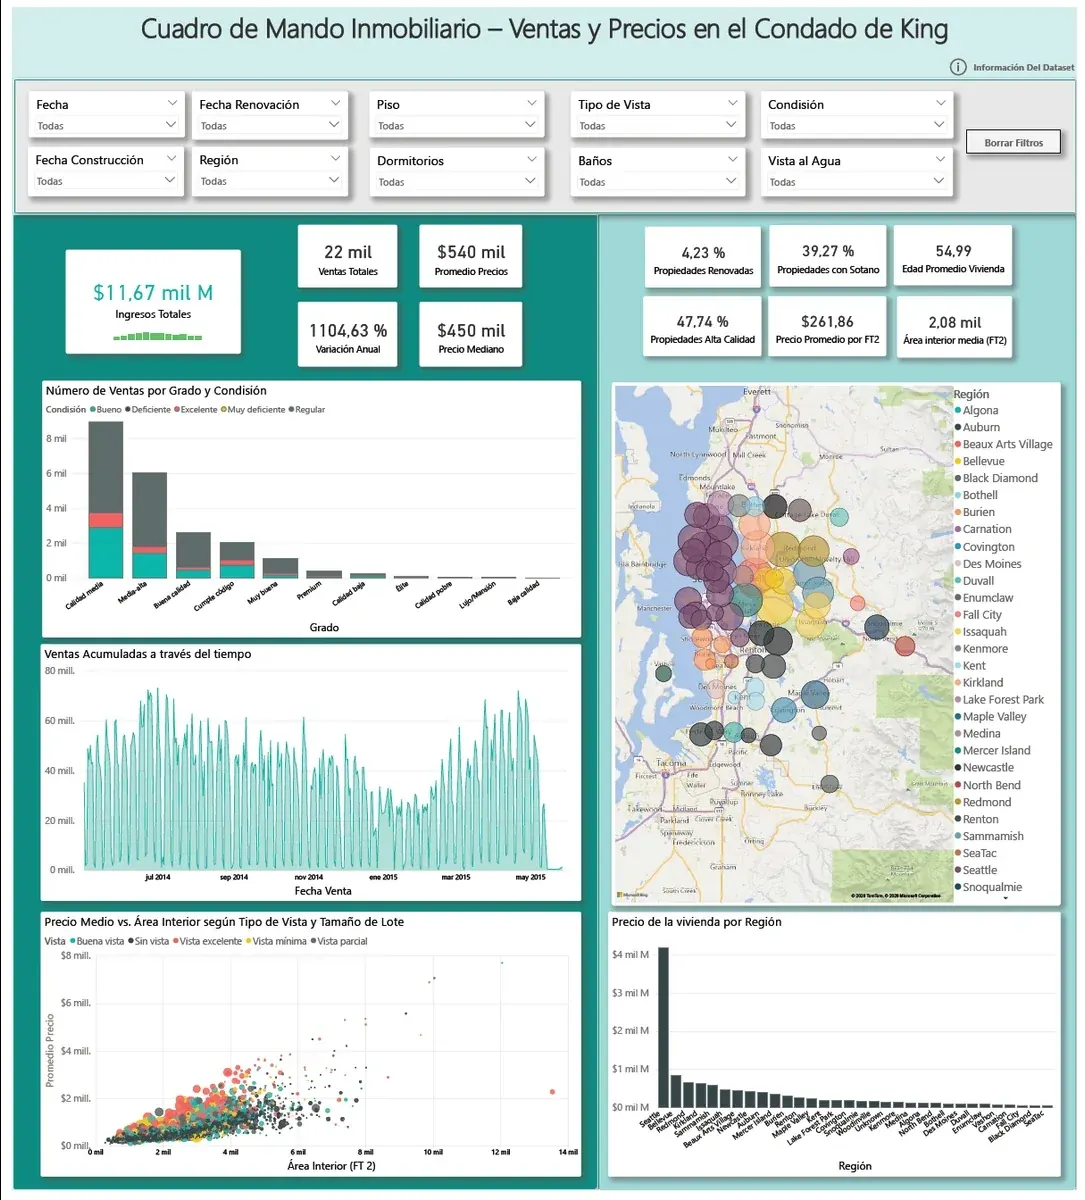
    What sells, where, when and at what price, with interactive maps.

Screenshot of the project Clínica Integral: appointment management

Business Intelligence · Client · Linares, Chile

Clínica Integral: appointment management

The medical center's management needed to see revenue, pending payments and each professional's performance in one place.

A dashboard with two connected views: management, with revenue, payment status, most requested services and busiest days; and operations, with the detail per appointment and each professional's performance against the average. Designed for non-technical users, with filters by date, location, professional and service.

Tools

  • Power BI
  • DAX
  • Power Query
  • Star schema
  • UX design
I want something like this
Screenshot of the project Oro Verde: fleet tracking

Business Intelligence · Client · Linares, Chile

Oro Verde: fleet tracking

The transport company needed to monitor its fleet and drivers from trip tracking data, focused on efficiency and road safety.

The dashboard brings together mileage, speeds, trip duration, stops, driving violations and fuel, by driver and by region, with a map of positions. An AI panel summarizes the main trends in plain language.

Tools

  • Power BI
  • DAX
  • Power Query
  • Maps
  • AI narrative analysis
I want something like this
Screenshot of the project Acertijo: financial statementsScreenshot of the project Acertijo: financial statements

Business Intelligence · Client · Colombia

Acertijo: financial statements

The company needed clear, up-to-date financial reports without preparing spreadsheets by hand at every close.

Two reports: the statement of financial position (assets, liabilities and equity with their movements) and a consolidated income statement, with its monthly evolution and top customers. It is fed by the automated accounting processor, so data moves from the books to the report with no manual work.

Tools

  • Power BI
  • DAX
  • Power Query
  • Python
  • Excel
I want something like this
Screenshot of the project Automated accounting processorScreenshot of the project Automated accounting processor

Automation · Data science · Acertijo, Colombia

Automated accounting processor

Cleaning, standardizing and consolidating each accounting balance in Excel before analyzing it took time and left room for errors.

The desktop application watches folders, detects new balances, transforms them and consolidates them into a model ready for Power BI, where the income statement, balance sheet and financial indicators are shown. It has a graphical interface, an exportable history and installs like any Windows program.

Tools

  • Python
  • pandas
  • openpyxl
  • watchdog
  • PyInstaller
  • Power BI
I want something like this
Screenshot of the project Shelf audit with computer vision

Artificial intelligence · Data science

Shelf audit with computer vision

In retail, checking that each store's refrigerators hold the right products, on the right shelf and in the right quantity is done with slow manual inspections that are hard to standardize.

The system locates each product in the photo, classifies it and compares it with the configured planogram. Based on the differences found, a language model recommends what to restock, remove or rearrange. It works as a web application and stores the metrics of each check.

Tools

  • Python
  • YOLOv8
  • PyTorch
  • Computer vision
  • LLM
  • Streamlit
  • MongoDB
I want something like this
Screenshot of the project Automated sales prospecting

Automation · Data science

Automated sales prospecting

Getting reliable leads usually means buying outdated lists or searching for businesses one by one.

The application searches for businesses on public maps, fills in emails and social profiles from the web, cross-checks them with the official company registry to add legal name and line of business, cleans the data and exports a database per city. All from a graphical interface and without paid APIs.

Tools

  • Python
  • Playwright
  • BeautifulSoup
  • RapidFuzz
  • SQLite
  • PySide6
I want something like this
Screenshot of the project Web analytics dashboard

Business Intelligence · Demo project

Web analytics dashboard

For marketing and management teams that need to understand in one place how site traffic behaves and which channels generate revenue, without checking separate reports from each platform.

It integrates sessions, users, bounce rate, conversion, revenue per user and retention, with revenue by channel and behavior by device, all filterable by channel, source and browser.

Tools

  • Power BI
  • DAX
  • Web analytics
I want something like this
Screenshot of the project Real estate market: Seattle and LondonScreenshot of the project Real estate market: Seattle and London

Business Intelligence · Demo project

Real estate market: Seattle and London

Two dashboards built on public data. The Seattle one answers what sells, when, where, at what price and with which attributes, with a choropleth map, price-versus-area scatter plot and a ranking by area.

The London one compares areas and property types to find where you get the most space for your investment, with a map, box plots and filters by price, area, borough and type.

Tools

  • Power BI
  • Tableau
  • DAX
  • Star schema
  • Maps
I want something like this

Tools

What we work with.

  • Power BI
  • Python
  • SQL
  • PostgreSQL
  • Excel
  • Artificial intelligence

Contact

Let's talk about your project

Tell us what you need and we will get back to you with a clear proposal.

Reach out

Use whichever channel you prefer. We reply with a clear proposal.

Working in Colombia, Chile and Canada

Send us a message

We'll reply to the email you leave us.

What do you need?